
Broomfield Budget Breakdown:
What Your Single-Family Home Really Costs for Local Government (2017–2026)
Introduction
Welcome to the Broomfield Budget Breakdown
What does your single-family home really cost the City and County of Broomfield each year — and who actually pays for it?
Using official city budget data (2017 Annual Budget through the 2026 Proposed Budget and Long Range Financial Plan), this page shows — in plain numbers and visuals — how much the average single-family home receives in services versus how much revenue it generates.
The short answer: homes cost the city far more than they pay back, creating an annual net loss of roughly $2,500–$2,900 per home that must be covered by other sources.
This analysis is not about criticizing services — Broomfield provides excellent police, parks, roads, public health, and community programs. It’s about transparency: showing residents exactly where the money goes, why costs have risen faster than population or inflation, and what realistic options exist to reduce the burden on taxpayers.Navigate the sections below to see the full picture:
Section 1: Big Picture — The famous “house graphic” showing total service costs and the net loss per home.
Section 2: Department Costs Over Time — How much each major department (Police, Parks, Public Works, Human Services, etc.) costs the average home — and how those costs have exploded since 2017.
Section 3: How the Gap is Covered — Who actually pays the difference: the critical role of commercial sales tax, business property taxes, and non-resident spending.
Section 4: Change since 2017 — How the revenue mix shifted (fewer direct fees, much more reliance on sales & property taxes) and why costs still outpaced population growth.
Section 5: How the CCOB Could Cut Costs — Realistic ways to slow spending growth without cutting essential services.
Section 6: Privatization – Lowering Cost Per Home — Which services could be contracted out or privatized, with estimated savings per household.
Section7: Closing and References
Section 1: The Big Picture
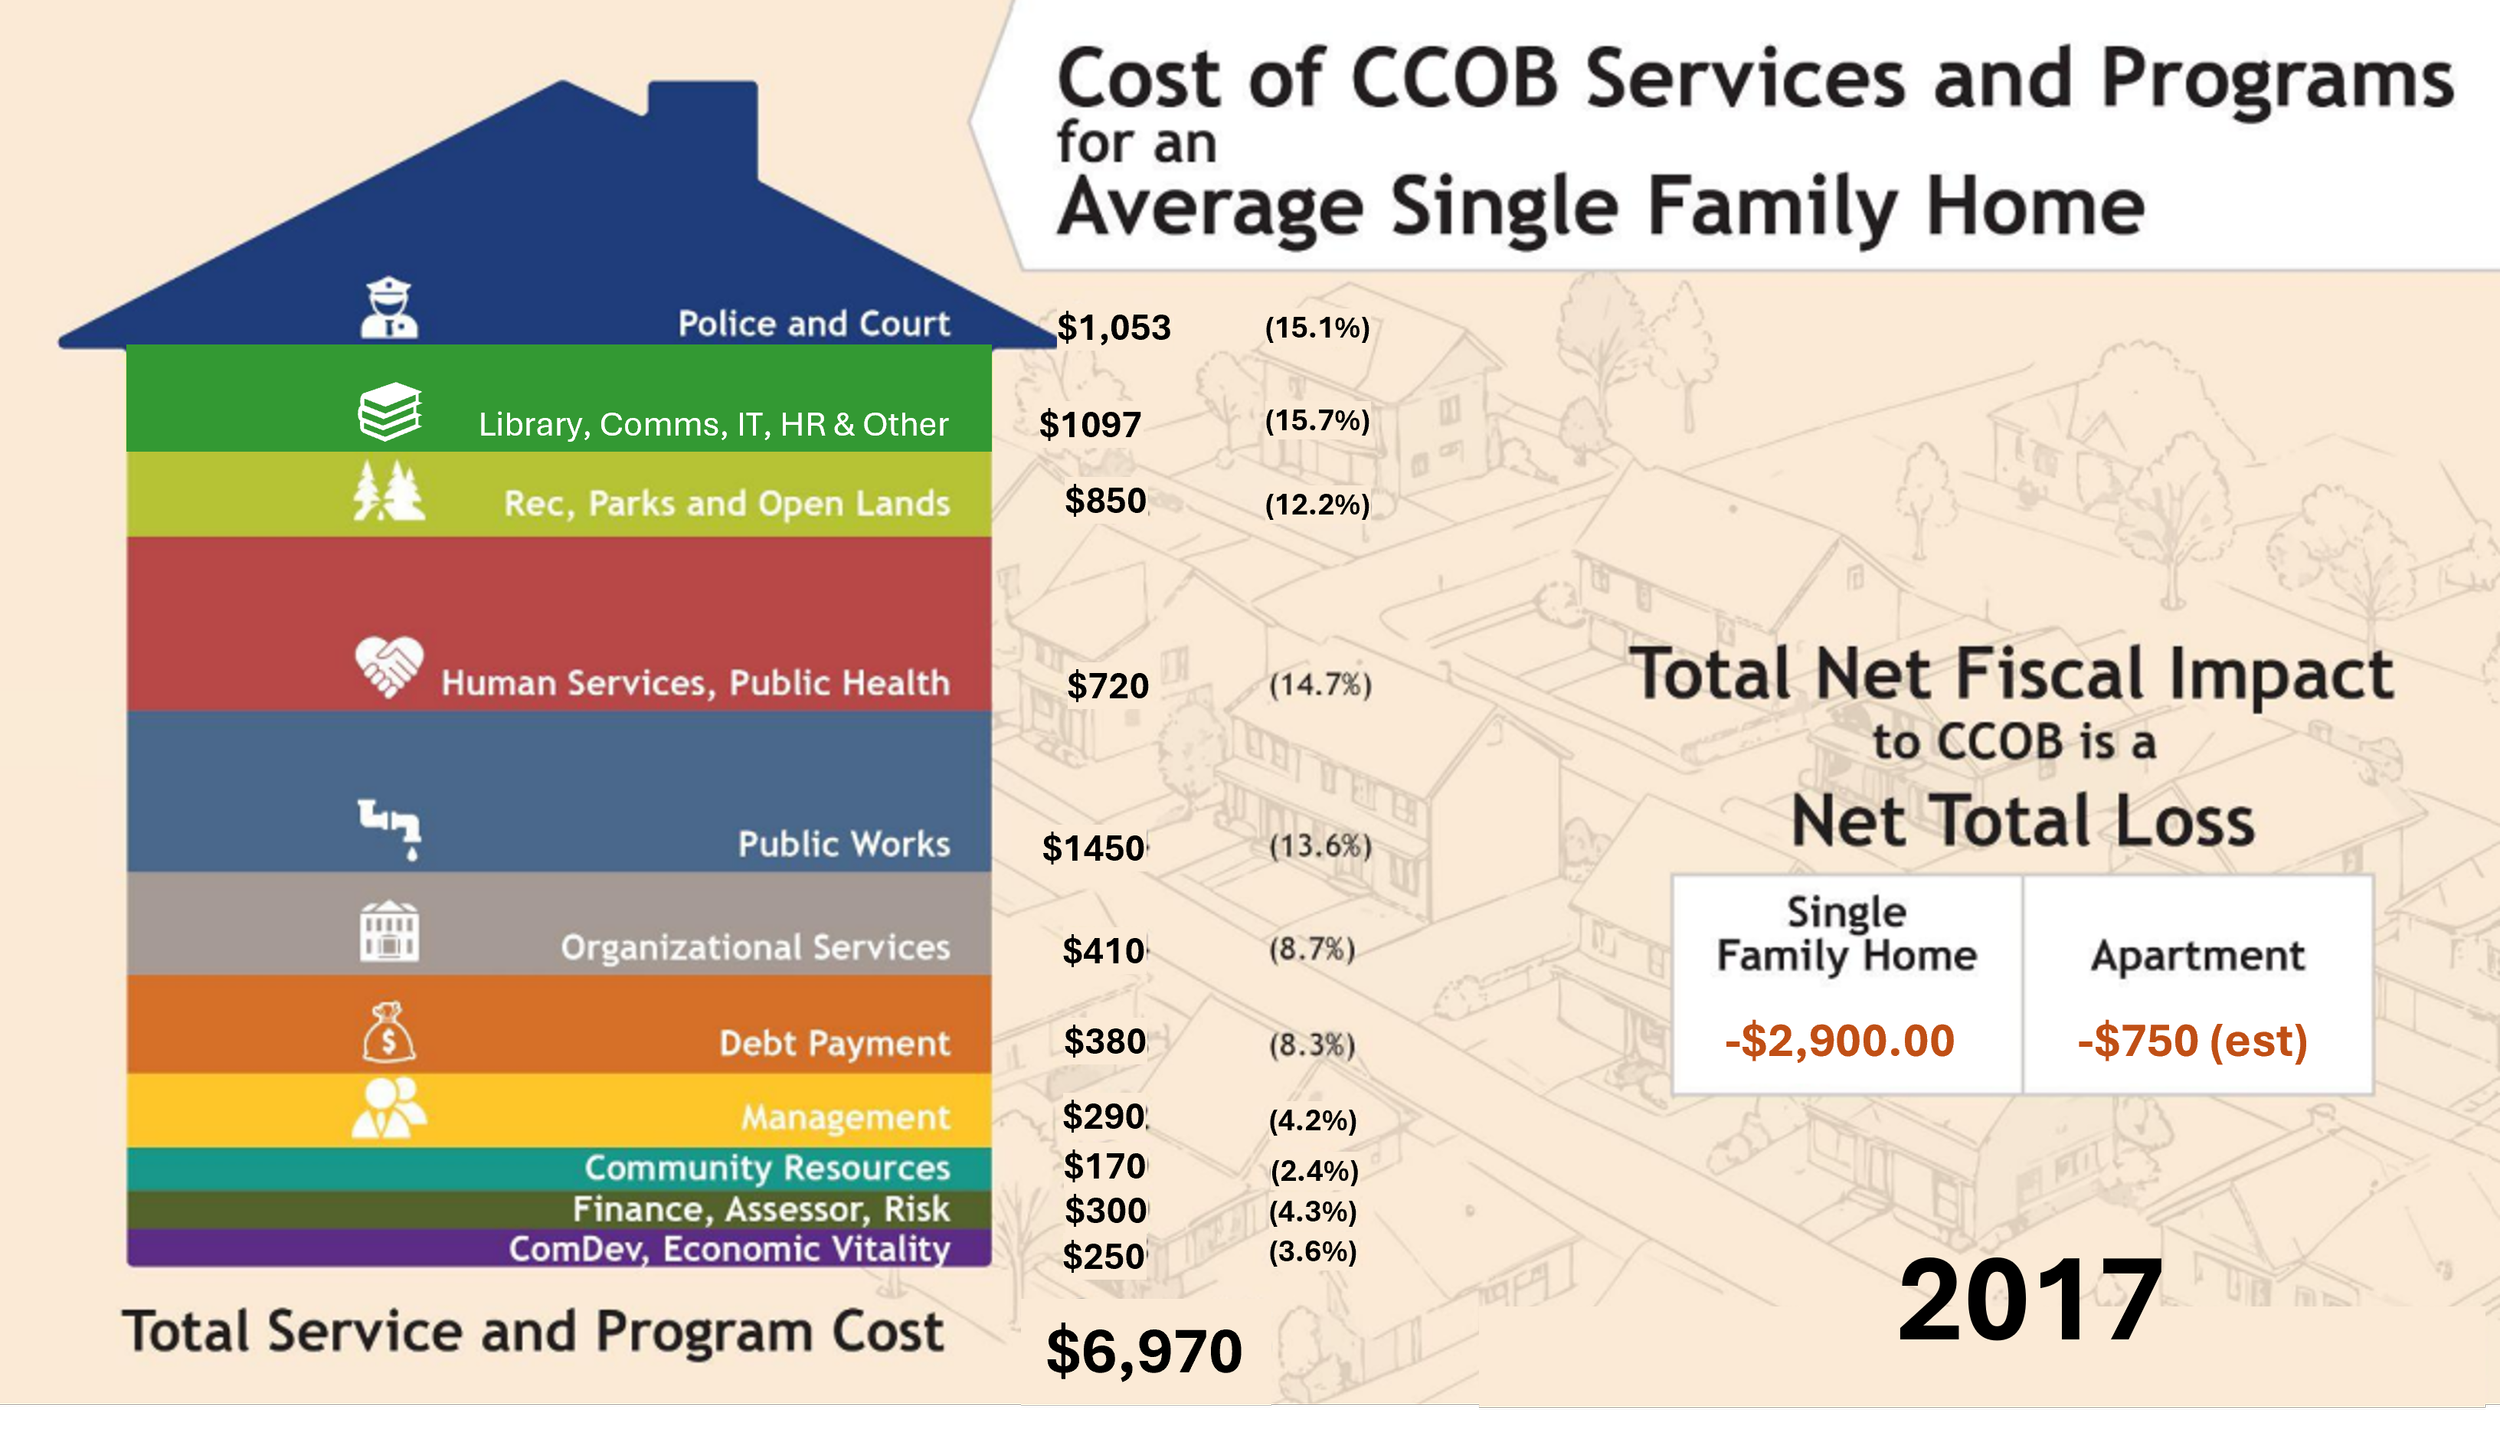
The City and County of Broomfield recently shared this graphic during the February 17, 2026 Study Session and on their Facebook page.
The graphic visualizes the annual cost of city/county services provided by the City and County of Broomfield (CCOB) to a typical single-family home and a single apartment.
Revenues and costs are based on 2024 actual financials.
The graphic shows that single-family homes cost Broomfield more in services than they generate in revenue, resulting in a deficit. Apartments have a smaller deficit due to higher density and different revenue patterns. Commercial and non-residential revenues help cover this shortfall.
To put the current numbers in context, we can approximate the 2017 cost-per-household and net fiscal loss using data from that year’s budget and household count. This allows a direct comparison to today’s figures, clarifying how the cost to the city and county has changed over time.
COMPARISON
The CCOB simply relied much more on direct user fees back then. Here’s exactly what changed:
Revenue Mix Shift
2017: The budget leaned heavily on enterprise-style fees (water, sewer, recreation, permitting) because sales tax and property tax were smaller slices (20% and 13%).
2026: Sales tax exploded to 36% and property tax grew to 26% (thanks to commercial growth at Flatiron Crossing, office development, and rising home values after the Gallagher Amendment repeal). The city no longer needed to ask residents to pay as much directly through fees.
Some Services Were Reclassified or Subsidized Differently
Recreation fees and certain public-works charges were partly moved into enterprise funds or general-fund subsidies.
The city also absorbed more costs into the General Fund (especially parks and human services) instead of passing them on as user fees.
Bottom-Line Effect on Residents
2017: You paid a bigger chunk of your “city bill” directly through higher water/sewer rates, recreation fees, permits, etc. (29% of revenue came from these).
2026: Those direct fees dropped significantly (now only 15%). The burden shifted to property taxes and especially sales tax — which is largely paid by businesses and non-residents.