
2024 IECC Update - Does this Help or Hurt Colorado Families?
If you’re a homeowner and taxpayer in Broomfield or anywhere along Colorado’s Front Range, you’ve felt the pressure of rising utility bills over the past few years. Electricity and natural gas prices have climbed noticeably, often keeping pace with (or even outrunning) everyday inflation. That monthly statement just one more thing to worry about, especially when you’re already doing your best to protect the environment, provide for your family, and raise your children to live in a successful society. Stress is an everyday occurrence.
So does Broomfield' council’s adoption of the 2024 International Energy Conservation Code (IECC) help or hurt citizens of Broomfield? These new permits go into effect starting April 15, 2026. Does it feel like a small but meaningful gesture of care for the future, or is it just one more regulation that will add costs to your already overburdened pocketbook?
This update is intended to improve the energy efficiency of buildings, thereby reducing operational costs over time. However, despite these measures, electricity and natural gas prices continue to rise. This raises important questions regarding when residential energy efficiency will be sufficient and why taxpayer expenses persistently increase even as homes are designed to use less energy.
Question: Does the increased efficiency support the increased costs?
What were the Core Changes in the 2024 IECC vs. 2021 IECC
Residential Provisions (Low-Rise: Single-Family, Townhomes, Multifamily ≤3 Stories)
Overall Efficiency: Targets ~7–10% better performance than 2021, with more flexible compliance (e.g., expanded trade-offs).
Compliance Pathways:
Prescriptive path: Some insulation relaxed (e.g., attic/ceiling R-value reduced by R-11 in many zones to offset other gains).
Simulated Performance (Section R405): Expanded modeling scope for trade-offs (more measures included).
Energy Rating Index (ERI) path: Stricter targets; renewable energy cap removed (previously 5%).
Key Envelope & Air Leakage Updates:
Tighter air leakage (e.g., increased stringency in CZ 0–2 and 6–8).
Fenestration (windows/skylights): More stringent U-factors in colder zones.
$150–$400 added cost
Continuous insulation strengthened in some zones to reduce thermal bridging.
Mechanical & Ventilation:
Energy recovery ventilation required in colder zones (CZ 6–8)
$975–$2,000 incremental (unit + install/duct mods)
Updates to HVAC efficiency and controls.
Additional Efficiency Credits (R408): Shifted to credit-based (like commercial), with more options (e.g., for heat pumps, renewables).
Readiness Provisions (often in appendices or optional):
Energy storage readiness (single-/two-family).
Electric vehicle charging readiness.
Solar/electric readiness (moved to appendices after appeals).
Total added cost for Readiness Provisions: $200–$500 (wiring/conduit: $100–$300; panel upsizing: $100–$200)
Other: Multifamily alignment across residential/commercial; demand response and all-electric options moved to appendices/resources.
Commercial Provisions
Overall: Builds on IECC 2021 with more credits/options; some electrification/decarbonization measures moved to appendices (e.g., heat pumps, demand response, EV charging, energy storage, all-electric paths) after ICC Board appeals decisions.
Lighting: Reduced power allowances; continuous dimming required in more spaces; removal of luminaire-level lighting control path; enhanced demand-responsive options.
Mechanical (C403): Expanded demand control ventilation; new occupied-standby/door interlock controls; updated humidification/dehumidification limits; Total System Performance Ratio (TSPR) option; higher boiler efficiencies (≥90% in some cases).
Envelope & Thermal: Stronger continuous insulation in more zones; tighter fenestration in cold climates.
Other: Reorganized water-heating performance (UEF basis); more credits required in C406 (based on occupancy/climate); readiness for renewables/storage/EV (appendices).
Many "decarbonization-heavy" proposals (e.g., mandatory renewables, all-electric mandates) were moved to appendices or resources after appeals, so the core mandatory code focuses on efficiency gains with flexibility rather than strict electrification.
States/localities adopt the IECC (or equivalents) with amendments; DOE determination encourages states to review/update codes to meet/exceed 2024 levels. For full details, check ICC publications or DOE's energy codes site.
Rising Electricity Rates in Colorado
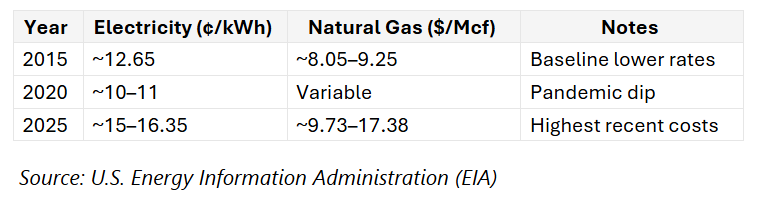
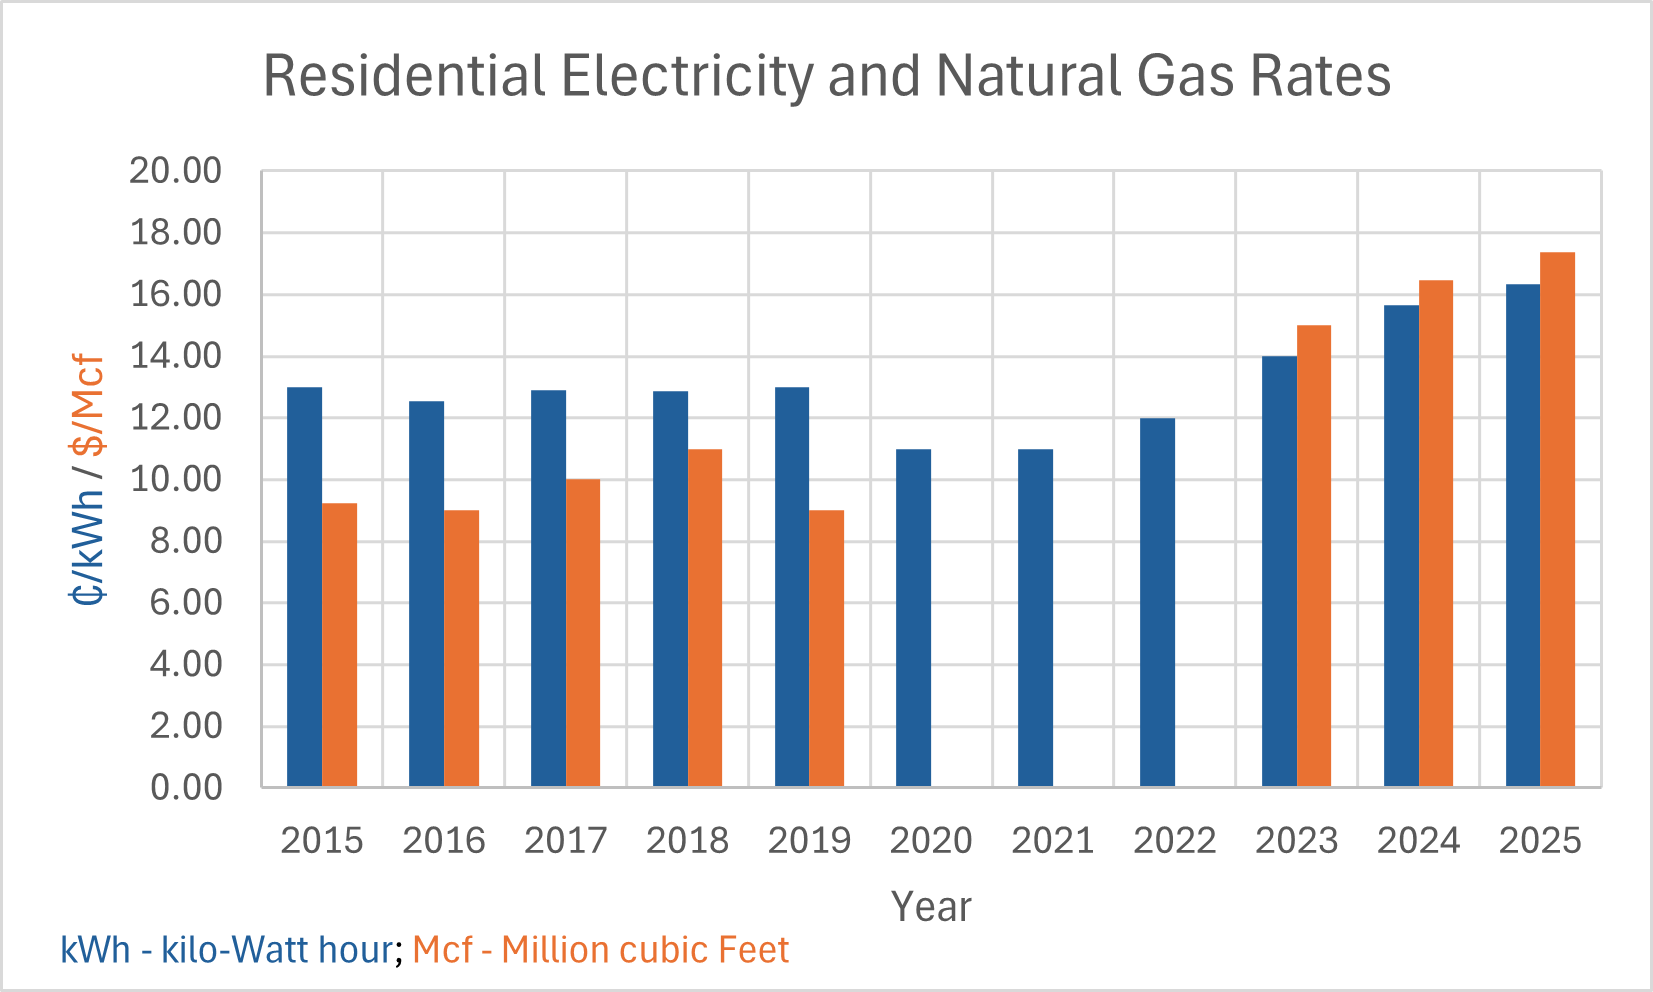
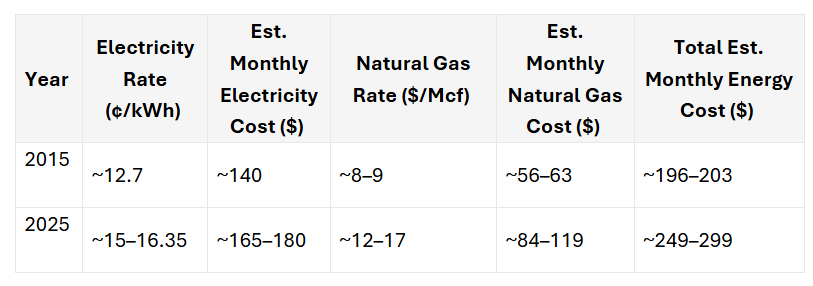
Colorado’s residential electricity rates have increased 25–35% over the past decade, often outpacing inflation. Average rates rose from 12¢/kWh in 2015 to 15–16¢/kWh in 2025. Efficiency measures like the 2024 IECC are supposed to help homeowners mitigate rising utility costs.
Historical Rates Table
Comparison to Inflation
Understanding the relationship between inflation and electricity rates provides valuable context for evaluating energy costs in Colorado.
National and Regional CPI Inflation (2015–2025)
Across the United States, the cumulative Consumer Price Index (CPI) inflation from 2015 to 2025 was approximately 28–32%. This estimate is based on Bureau of Labor Statistics (BLS) data, which reported about 0.1% inflation in 2015, a peak of 8.0% in 2022, and recent rates around 2.7–3.0%, totaling roughly 30% by late 2025.
In the Denver area, commonly used as a proxy for Colorado, CPI trends were similar or slightly higher. Some Denver-specific calculations show a cumulative increase of about 36% from 2015 baselines.
Colorado Electricity Rate Trends Compared to Inflation
Overall, electricity rates in Colorado have generally increased at or slightly above the pace of inflation during this period.
Between 2010 and 2020, rates were relatively flat, growing at about 0.6% annually, which was below the rate of inflation.
After 2020, rates began to increase more rapidly, with some periods experiencing rises of 15–20% or more. These increases have exceeded inflation, particularly in recent years, coinciding with coal phase-outs and growth in renewable energy.
Analyses such as those from the Common Sense Institute project that future electricity rates in Colorado could grow two to three times faster than inflation. For example, projections suggest a 56% increase in rates by 2030 compared to an estimated 16% rise in inflation at 2.5% annually. If these trends continue, households could see their annual bills increase by hundreds of dollars.
Context and Implications
Despite the upward trend, Colorado's electricity rates remain below the national average, at roughly 17–18¢ per kWh in 2025–2026. However, the ongoing increases—often driven by clean energy mandates—highlight the importance of efficiency upgrades. Implementing measures such as those outlined in the 2024 International Energy Conservation Code (IECC) can help offset rising bills through reduced energy usage.
Average Monthly Energy Usage
For a 2,400 sq ft home:
Electricity: 1,000–1,200 kWh/month (lower in Colorado: 900–1,100 kWh)
Natural Gas: 50–100 therms/month (higher in winter)
Efficiency improvements have slightly reduced average consumption per square foot, but rising rates have increased monthly bills by 25–50% since 2015.
Note: While the U.S. Energy Information Administration (EIA) does not provide a precise breakdown of usage by exact square footage, estimates can be derived by scaling national averages with per-square-foot benchmarks.
Estimated Monthly Cost Changes (2015 vs. 2025)
Average Monthly Energy Usage for a 2,400 Square Foot Home
The energy consumption of a typical 2,400 square foot home in the United States depends on multiple variables including:
climateinsulation qualitynumber of occupantsappliance efficiency (especially HVAC systems)whether the home is all-electric or uses mixed fuelsand regional factors

Electricity Usage
National U.S. Average: Most households consume approximately 855–900 kWh per month. This figure comes from EIA data in recent years, which cites 899 kWh/month for homes sized around 1,800–2,200 square feet.
Per Square Foot Benchmark: Commonly referenced values fall between 0.41–0.49 kWh per square foot per month, as derived from EIA estimates and sources such as Constellation and Aurora Solar.
For a 2,400 sq ft Home: Applying the per-square-foot benchmarks, average usage works out to roughly 1,000–1,200 kWh per month (using 0.42–0.50 kWh/sq ft).
Lower end (~1,000 kWh): Homes that are well-insulated, located in moderate climates, equipped with efficient appliances, and exhibit moderate usage.
Higher end (~1,200–1,500+ kWh): Homes with high AC/heating loads (common in hotter or colder regions), those with pools, electric vehicles, or larger families.
Real-world examples: Some reports indicate a range of 1,000–2,000 kWh for homes between 2,000–2,500 square feet, with all-electric homes often at the higher end.
Colorado-Specific Note: Colorado homes generally use less electricity than the national average, due to milder summers and reduced reliance on air conditioning. Average homes often consume 700–900 kWh/month, but for a 2,400 square foot home, usage may still fall between 900–1,200 kWh, depending on heating type and winter electric demand.
Natural Gas Usage
Natural gas consumption is more variable and harder to attribute directly to square footage. It is influenced by space heating, water heating, cooking, and other factors, and is typically measured in therms (1 therm ≈ 100,000 BTU) or Mcf (thousand cubic feet; 1 Mcf ≈ 10 therms).
National U.S. Average: Residential natural gas use averages 50–80 therms per month annually, with higher usage in winter due to heating and near zero consumption in summer for many homes. EIA data shows a gradual decline in per-household use over time as efficiency improves.
For a 2,400 sq ft Home: Estimates vary:
Winter months (heating season): Usage ranges from 80–150+ therms, with older or less efficient homes potentially reaching 100–200 therms during cold periods.
Annual average: Typically 50–100 therms per month when averaged over the year, as many homes primarily use gas for heating and hot water.
Real-world anecdotes: Similar-sized homes often see winter bills reflecting 100–200 therms/month in colder climates, while summer usage may be 10–30 therms for water heating and cooking.
In Colorado: Despite colder winters, newer homes tend to use slightly less natural gas thanks to improved insulation. However, expect increased consumption during the winter months.
Key Factors Influencing Energy Usage
Climate/Region: Hot climates increase electricity demand for air conditioning, while colder regions see higher gas and electric usage for heating.
Efficiency: Newer homes with good insulation, such as those adhering to the 2024 IECC standards, typically use 10–30% less energy.
Fuel Type: All-electric homes generally have higher electricity usage, whereas mixed-fuel homes balance electricity and gas consumption.
Occupants/Appliances: Greater numbers of occupants, the presence of electric vehicles, pools, or outdated systems can significantly raise energy usage.
So, if these improvements to the code result in lower costs, why do costs keep increasing?
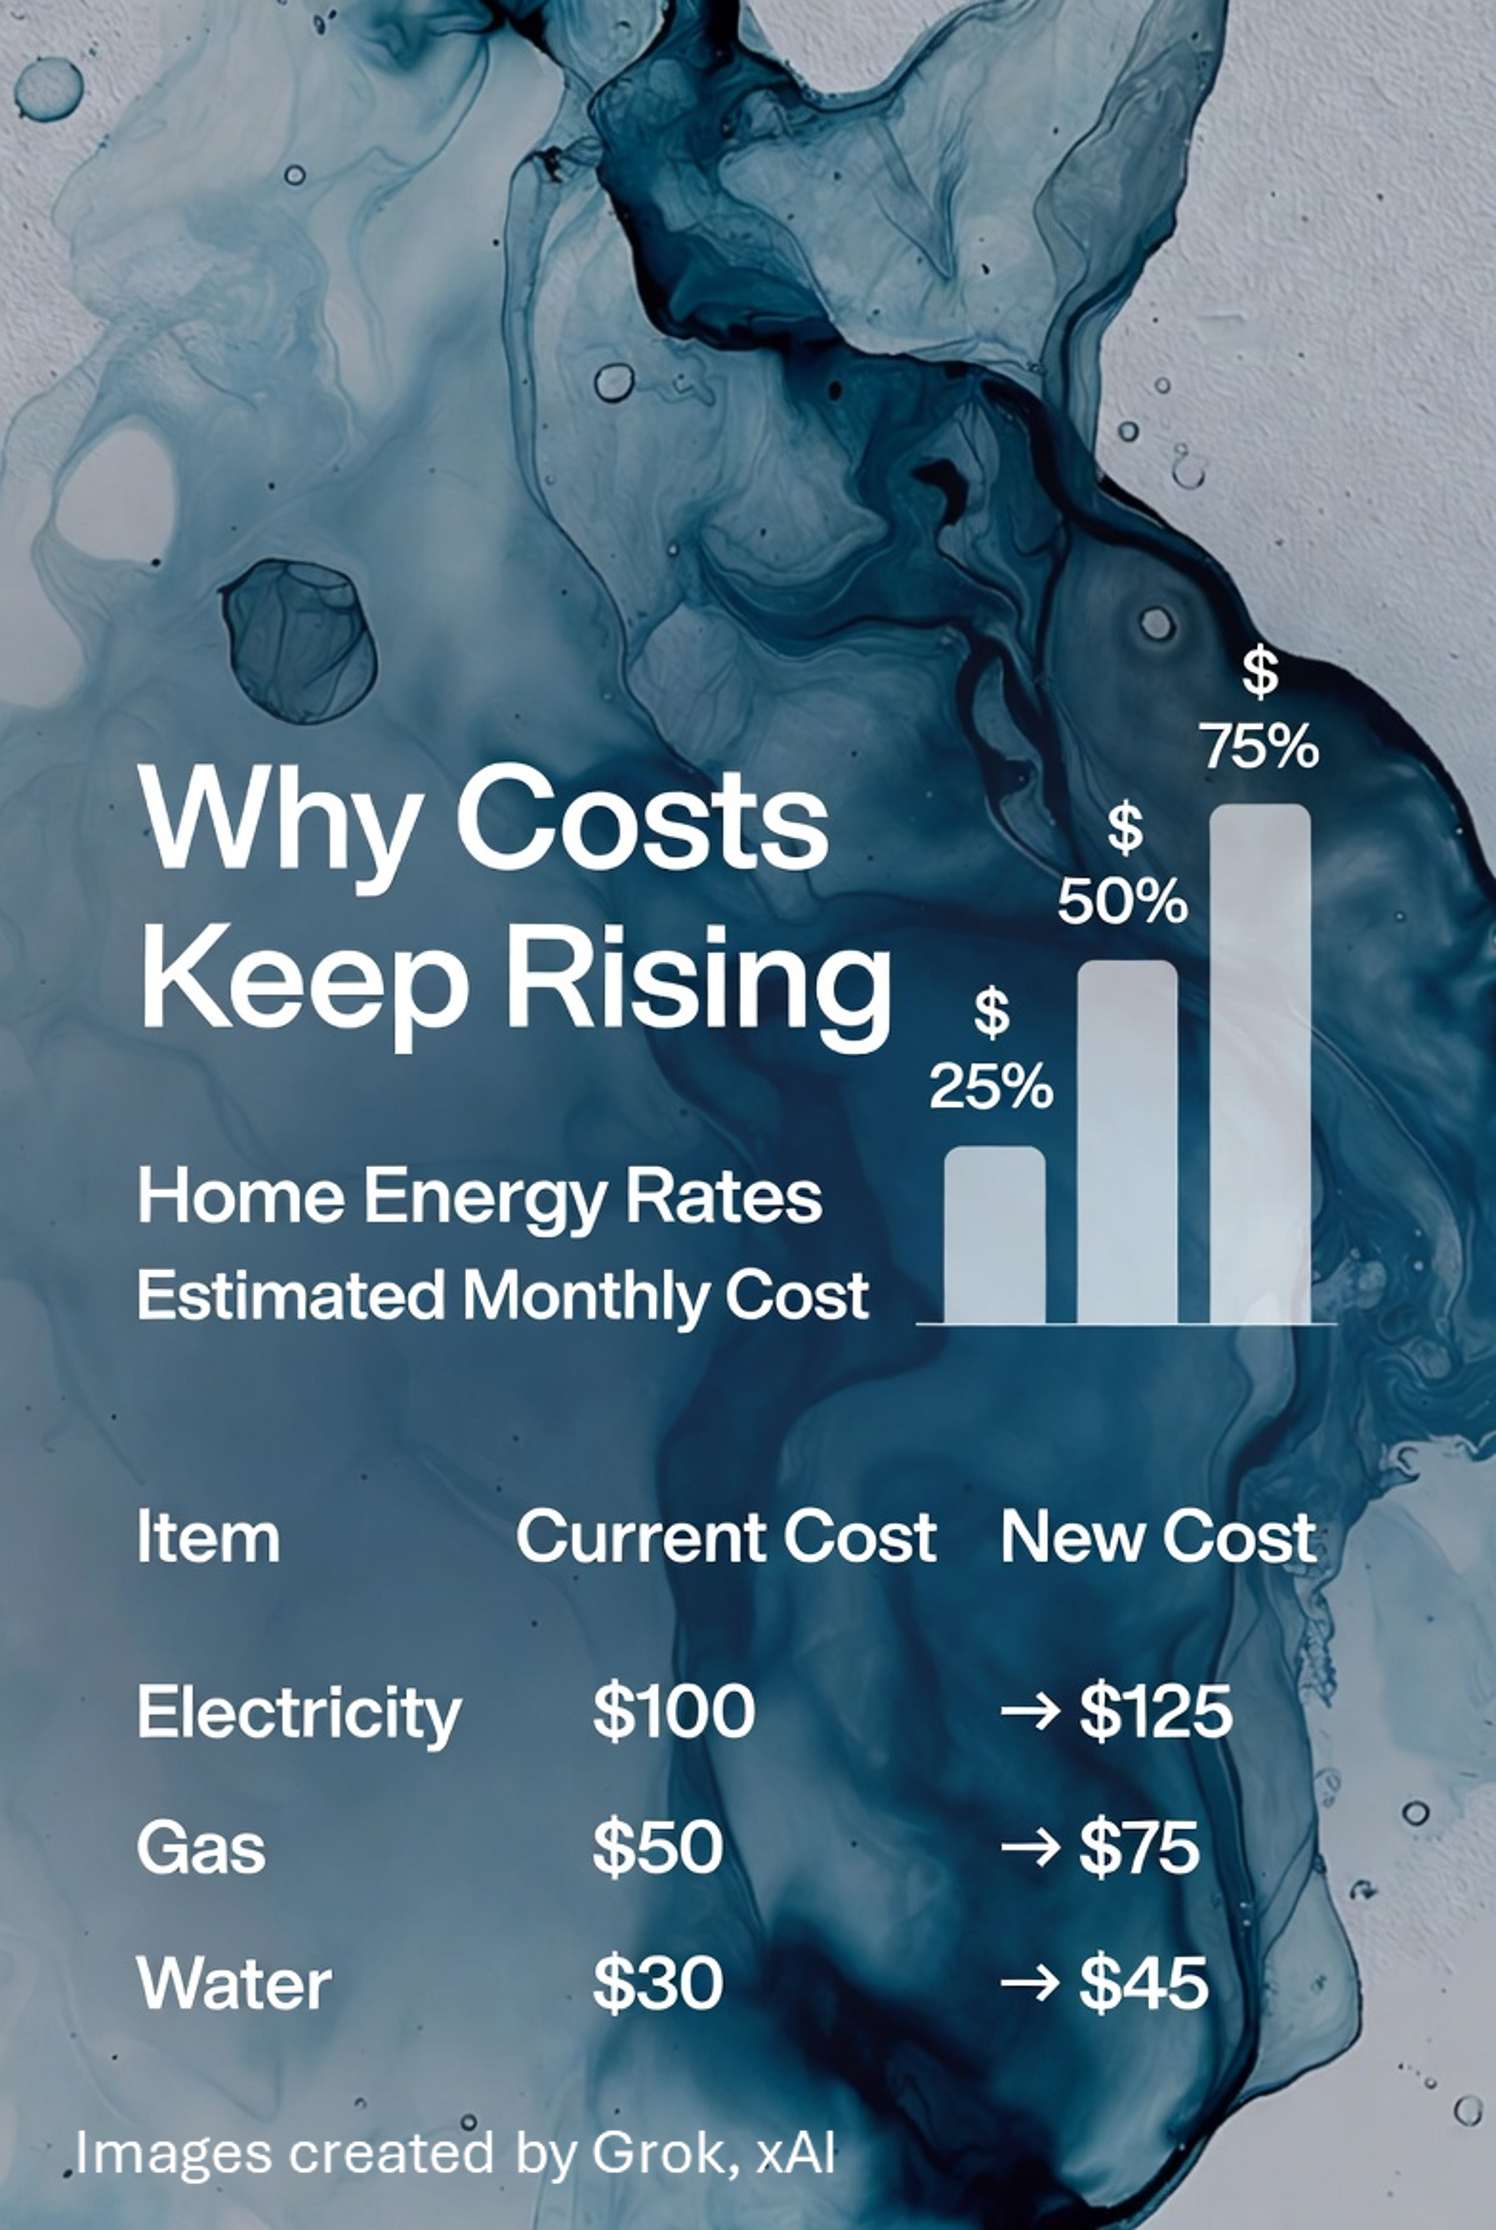
Why Costs Keep Rising
Overall new home prices (and even some utility bills) keep climbing. It's frustrating, especially when efficiency upgrades are sold as a way to save money. The key is that energy code improvements are only one small piece of a much bigger puzzle. They add a relatively minor incremental cost (often $0–$2,000 nationally, and sometimes savings in Colorado's climate zones per NAHB analyses), but they're dwarfed by other, much larger forces driving up construction and home prices since around 2020–2026.
Soaring Material Costs and Supply Chain Issues
Building materials (lumber, steel, concrete, roofing, etc.) rose dramatically—up 41.6% since the pandemic in many cases (NAHB data). Tariffs on imported materials alone can add $10,000+ to the cost of a new single-family home. These increases far outpace any added expense from energy codes.
Labor Shortages and Rising Wages
There's a persistent shortage of skilled construction workers (exacerbated by retirements, immigration policies, and competition from other industries). Wages for tradespeople have risen 4–5% annually in recent years, pushing overall construction costs higher. This affects every home built, regardless of energy standards.
High Interest Rates and Financing Costs
Mortgage rates spiked from ~3% in 2020–2021 to 6–7%+ in 2022–2025 (and stayed elevated), making borrowing more expensive for builders (construction loans) and buyers alike. Higher rates slow sales, reduce builder volume, and get passed on in pricing.Land, Zoning, Permitting, and Regulatory Barriers (Beyond Energy Codes)
Land prices in high-demand areas like Colorado's Front Range have skyrocketed due to limited supply. Zoning restrictions, lengthy permitting processes, impact fees, and other non-energy regulations add significant costs—often 20–25% of a new home's price (NAHB estimates). These "supply-side" limits create scarcity, which drives prices up more than any single code change.Broader Inflation and Economic Cycles
General inflation (especially 2021–2023) hit construction hard. Home prices rose in most markets due to low inventory and high demand, even as new construction lagged. Energy codes contribute only a tiny fraction (e.g., studies show 0.6–4% price impact in some cases, often offset by buyer demand for efficient features).
Energy codes add a small upfront cost but are overwhelmed by larger market forces. They remain one of the few tools delivering ongoing savings to offset broader cost pressures.
Beyond Energy Codes
These are the main categories of costs/delays that are not related to energy efficiency but still make homes more expensive:
Land Costs & Availability
High land prices due to limited supply (zoning restrictions reduce developable land).
In high-demand areas (e.g., Denver metro, Boulder County), raw land can cost $100,000–$500,000+ per lot before any building starts.
Zoning & Land-Use Regulations
Minimum lot sizes (e.g., 5,000–10,000 sq ft minimums in many suburbs).
Single-family-only zoning (bans duplexes, townhomes, apartments in large areas).
Height limits, setback requirements, parking minimums, design review boards.
Result: Fewer homes built per acre → higher per-unit land cost.
Permitting & Approval Process
Lengthy reviews (6 months to 3+ years in some jurisdictions).
Multiple agencies (city planning, county, state, environmental, utilities).
Impact fees, development fees, school fees, park fees—often $20,000–$100,000+ per home in Colorado.
NIMBY-driven appeals and lawsuits delay projects.
Other Non-Energy Regulations
Stormwater management, open-space set-asides, tree preservation, architectural review.
Historic preservation overlays, floodplain rules, wildfire mitigation codes.
Building codes unrelated to energy (structural, plumbing, electrical, fire safety).
Real Numbers (from NAHB and Other Sources)
NAHB Cost of Construction Study (2024): Regulatory costs (including land development, impact fees, permitting) average 24.3% of the final home price—far more than energy code add-ons.
NAHB Regulatory Burden Report (2021, updated 2024): Average regulatory cost per single-family home = $93,870 (2021 dollars), with land-use/zoning/permitting being the largest share.
Terner Center (UC Berkeley, 2023–2025): In high-cost markets, zoning and permitting delays add 20–50% to home prices.
Colorado-specific: In Denver metro, impact fees alone can exceed $30,000–$60,000 per home; zoning restrictions limit density and increase land costs dramatically.
Why This Matters More Than Energy Codes
Energy code add-ons (e.g., 2024 IECC) are typically $0–$2,000 (PNNL/NAHB), with long-term savings.
"Beyond energy codes" costs (zoning, fees, delays) are tens of thousands per home and make supply scarce, driving up prices regardless of efficiency standards.
In short: Even if energy codes were eliminated tomorrow, home prices would barely budge because land, zoning, and permitting are the real bottlenecks. These barriers create artificial scarcity, which is why many economists and housing experts call for zoning reform (e.g., allowing more density, reducing fees) as the biggest lever for affordability.

Why Utility Rates Keep Increasing
More efficient homes mean utilities sell fewer kilowatt-hours (kWh) or therms overall per customer, but their fixed costs (running the grid, building/maintaining power plants and pipelines, complying with regulations, recovering from storms, etc.) don't go down proportionally.
In many cases, those fixed costs are actually rising faster than efficiency gains can offset them. Utilities then spread those costs across fewer units sold, which pushes the per-unit rate higher—even as your total consumption drops.This is a well-documented dynamic called the "utility death spiral" or "fixed-cost recovery challenge": efficiency and conservation reduce sales volume, so rates increase to cover the same (or growing) overhead, which can discourage further efficiency... and the cycle continues.
Major Drivers of Rate Increases
There are several key factors contributing to the rise in energy rates. Each of these drivers plays an important role in shaping the price consumers pay for electricity and gas services.
Massive Infrastructure Investments and Grid Upgrades: Utilities are undertaking significant investments to modernize and expand the energy grid. These improvements, including updating transmission lines and distribution systems, require substantial funding and are reflected in rate increases.
Transition from Coal to Renewables and Electrification Policies: The shift away from coal-fired power plants toward renewable energy sources, as well as policies promoting electrification, result in additional costs. Utilities must develop new generation facilities and adapt to evolving regulatory requirements, impacting rates.
Aging Infrastructure and Extreme Weather Recovery: Many energy systems are aging and in need of repair or replacement. Additionally, utilities must invest in recovery efforts following extreme weather events, further driving up costs.
Fuel Cost Volatility and Global Factors: Fluctuations in fuel prices, influenced by global market dynamics, have a direct effect on the cost of energy production. These changes are passed on to consumers through rate adjustments.
Demand Growth from Non-Residential Sources: Increased demand from sectors such as commercial, industrial, and institutional customers can strain the energy supply and infrastructure, resulting in higher rates to support expansion and maintenance.
Regulatory and Profit Structures: Regulatory frameworks and profit models established by governing bodies influence how rates are set. Changes in these structures can affect the pricing of energy for consumers.
What would happen if there were no energy mandates?
This question gets to the heart of the trade-off between mandates and markets. If the government (or the IECC) stopped mandating these energy efficiency standards for new buildings, here's what would likely happen, based on historical data, economic studies, and real-world examples from states and countries with weaker vs. stronger codes.
Short-Term (1–5 Years)
Lower construction costs and home prices: Builders would save on insulation, better HVAC, tighter envelopes, etc. The NAHB and PNNL analyses we discussed earlier show the 2024 IECC adds $0–$2,000 on average — without mandates, that money stays in builders' pockets or gets passed to buyers. New homes would be 5–15% cheaper to build in many cases.
Faster housing supply: More homes built, especially in high-demand areas. This could ease the housing shortage and lower prices slightly (though land, labor, and materials are still the bigger drivers).
Slower efficiency gains: New homes would revert to older, less efficient baselines (similar to pre-2010s codes). The average new home would use 10–20% more energy than under current mandates.
Medium-to-Long Term (5–30 Years)
Higher lifetime energy bills for homeowners: Without mandates, the market would still reward some efficiency (buyers prefer lower utility bills, and labels like ENERGY STAR would help). But adoption would be slower and uneven. Studies show voluntary markets achieve only 30–50% of the efficiency gains of mandates (e.g., ACEEE and Lawrence Berkeley Lab analyses).
Result: The average U.S. home would use more electricity/gas over its 30–50 year life. In Colorado (with rising rates), this means $200–$500+ extra per year per home in today's dollars, compounding over time.
Higher overall emissions and grid strain: More energy demand from the building stock. This would exacerbate the data center/AI boom you mentioned earlier — utilities would build more gas/coal plants to meet peak loads, keeping rates higher longer.
Innovation trade-off:
Positive: Less regulation could spur voluntary innovation (e.g., premium "net-zero" homes as a luxury feature, like in parts of Europe or Australia with lighter mandates).
Negative: History shows mandates drive the biggest leaps in efficiency (e.g., the 1970s–1980s oil crises + early codes led to massive improvements). Without them, progress slows — see the U.S. South, where weaker codes correlate with higher per-home energy use despite cheap power.
Real-World Evidence
States with weak/no mandates: Texas, Florida, and some Southern states have looser codes. New homes there are cheaper but use 15–25% more energy than in strict states like California or Massachusetts (per EIA RECS data). Homeowners pay more over time, but builders sell faster.
Countries with minimal mandates: Australia and parts of Canada rely more on incentives/labels. Efficiency improves, but slower than in Europe (with strict codes). Result: Higher national energy use per capita in buildings.
Pre-mandate era (pre-1970s U.S.): Homes were far less efficient. The 1973 oil crisis exposed this — mandates were a direct response, and they worked: U.S. residential energy intensity dropped ~50% since then, even as homes got bigger.
Mandates do accelerate efficiency in ways pure markets often don't, because of (Grok’s take):
Split incentives: Builders care about upfront cost; buyers care about lifetime bills (and most don't do the math).
Externalities: Emissions and grid costs aren't fully priced into energy markets.
Information problems: Buyers can't easily test a home's efficiency.
But — blanket mandates can go too far. The 2024 IECC is mostly performance-based and flexible, so it's not the worst offender. The real problem is when codes become overly prescriptive or ignore local conditions (e.g., cheap energy areas vs. expensive ones).
Without mandates, we'd get:
More affordable housing short-term.
Slower decarbonization and higher long-term bills.
A more market-driven (but patchier) efficiency landscape.
The optimal world is targeted, flexible mandates + strong price signals (e.g., carbon taxes or accurate rate structures) + transparent labeling. Pure laissez-faire would leave too much inefficiency on the table; heavy-handed rules distort markets and raise costs unnecessarily.
What would a "no mandates, free-market grid" scenario look like for Colorado?
This is a hypothetical projection to 2030–2035, assuming:
Deregulation: Competitive wholesale generation market (like ERCOT).
No IECC mandates: Homes built to pre-2010 efficiency levels.
Streamlined permitting: Transmission lines built in 3–5 years (vs. 10+).
Data centers pay full costs: No subsidies; they co-locate generation or pay grid upgrades.
Market incentives: Prices reflect scarcity; competition drives efficiency.
Scenario Overview
Current Regulated Grid (2025 Baseline):
Xcel (80% of CO power) faces 5.8 GW data center demand (nearly current total capacity).
Needs $22B infrastructure by 2040; 950 MW new generation in 5 years.
Residential rates: Proposed +9.9% in 2026 (~$10/month increase).
Data centers: 2/3 of new demand; residential subsidizes via rates.
Grid: Coal/gas dominant (60%), renewables growing slowly.
Free-Market Scenario:
Generation: Private companies build gas, nuclear, solar+storage where profitable.
Transmission: Private investment + fast permits (e.g., "critical" designation like Texas).
Homes: No mandates → cheaper builds, but market pressure for efficiency.
Data Centers: Full cost recovery → on-site power or premium rates.
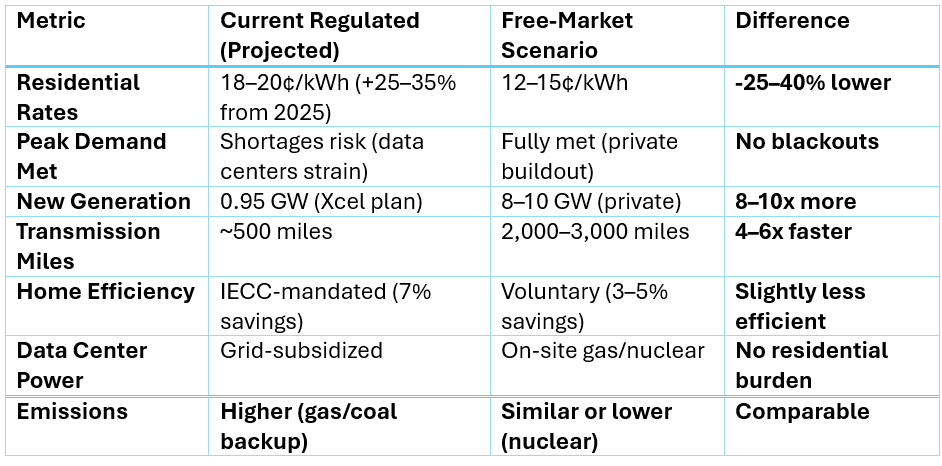
Projected Impacts (2030)
Key Dynamics
Rates Drop Due to Competition:
Texas ERCOT (deregulated): Wholesale prices 20–30% lower than regulated states; data centers thrive without rate hikes.
Colorado: Private generators compete → more supply, lower prices. Data centers pay full cost (e.g., $0.05–0.08/kWh premium tariffs) instead of subsidizing via residential bills.
Grid Upgrades Accelerate:
No mandates = profit motive for transmission (private lines, "merchant" projects).
Data centers co-locate (e.g., next to new gas plants or small nuclear) → less strain on main grid.
Result: 2–3x faster buildout than Xcel's regulated plan.
Homes: Cheaper Upfront, Slightly Higher Bills:
No IECC: New homes $1,000–2,000 cheaper.
But rising rates (even lower than regulated) incentivize voluntary efficiency (ENERGY STAR, heat pumps) via market signals.
Net: Homeowners save $500–1,000 over 30 years vs. current path (less than mandated, but no forced cost).
Data Centers: Pay Their Way:
Full cost recovery → developers build on-site power (gas peakers, nuclear SMRs) or pay transmission fees.
No "free ride" on residential rates → less hypocrisy.
Risks and Trade-Offs
Short-Term Volatility: Initial rate spikes from data center surge, but competition stabilizes faster.
Reliability: ERCOT-style markets have winter risks (e.g., 2021 Uri), but better incentives for backups.
Emissions: More gas short-term, but nuclear/renewables compete on cost.
Equity: Low-income homes benefit from lower rates; builders gain from flexibility.
Overall: In this scenario, Colorado's grid becomes more like Texas — abundant power, lower long-term rates, faster infrastructure. Data centers drive growth without burdening residents. The "inefficiency" solves itself via competition, not mandates.This aligns with your Robertson-style free-market view: Markets fix what government can't. Real-world proof in ERCOT's handling of similar demand.

Data Sources
U.S. Energy Information Administration (EIA)
https://www.eia.gov/electricity/monthly/
https://www.eia.gov/dnav/ng/hist/n3010co3m.htm
National Association of Home Builders (NAHB)
U.S. Department of Energy (DOE)
ACEEE, ASAP, MIT studies
2024 International Energy Conservation Code: Affordable Efficiency for Colorado Homes
The 2024 International Energy Conservation Code (IECC) brings significant improvements to residential energy efficiency, especially in places like Broomfield, Colorado. Effective April 15, 2026, these updates emphasize electric-preferred designs, better insulation, efficient HVAC, and flexible compliance options. National studies show the 2024 IECC delivers 6–10% annual energy cost savings compared to the 2021 code, with modest or even lower upfront construction costs in many climate zones.
Key Benefits & Cost Breakdown
For a typical single-family home (~2,400 sq ft):
Upfront Cost: $0–$2,000 (often cost-neutral or savings)
Annual Energy Savings: 6.6% ($200–$500/year)
Payback Period: ~2.5 years
Life-Cycle Savings (30 years): $5,000–$15,000+ (including incentives)
Warmer/Mixed Zones: Often show cost savings ($440–$7,560 lower construction costs), 5.5–9% annual savings, payback 0–6 years.
Colder Zones: Higher upfront costs ($2,000–$10,000+), 7–10% annual savings, payback 5–15 years, but still cost-effective long-term.
Why It Matters
These updates mean lower utility bills, reduced carbon emissions, improved comfort, and resilience against energy price fluctuations. Builders gain flexibility, and homeowners see ongoing savings that often offset any modest upfront premium quickly. Larger homes face stricter requirements but still benefit from long-term savings.